

A long-running FHIR import that emits no metrics is a coin flip. Halfway through you have no idea whether the pipeline is healthy, degraded, or about to fail. Adding a small set of metrics turns a coin flip into a decision. The site's Bulk import time estimator tells you what the numbers should look like; monitoring tells you what they are. For the wider FHIR framing, additional FHIR write-ups for outpatient IT has more.
The Six Metrics That Matter
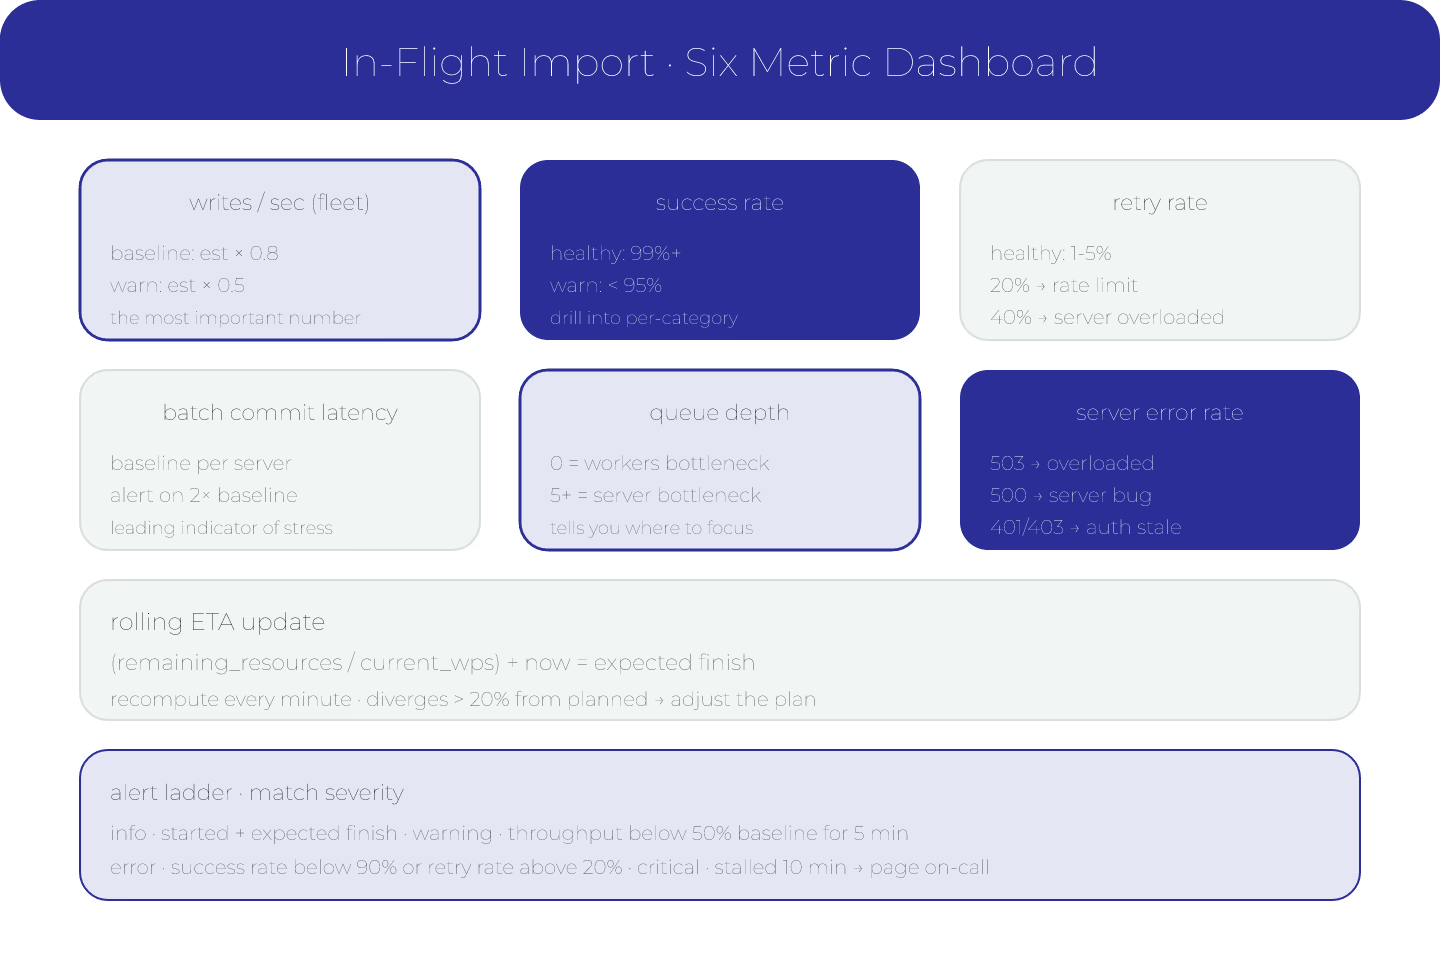
- Writes per second (fleet aggregate)
- Success rate
- Retry rate
- Batch commit latency
- Queue depth (workers waiting for server)
- Server error rate
Six numbers. Each answers a specific question about health. Together they diagnose almost any real problem.
Writes Per Second
The single most important number. Compare against the estimate. If actual is 80% of estimated, you are on track. If actual is 30% of estimated, something is wrong.
For the estimate framing, predicting how long a FHIR data import will take is the entry.
Success Rate
Successful writes / attempted writes. Healthy imports run at 99%+. Anything below 95% needs investigation.
Common causes of low success rate:
- Validation failures (payload shape wrong)
- Rate limiting (server pushing back)
- Reference errors (target not yet written)
- Auth failures (token expired)
Each has a different fix. Alert on the raw rate; drill into per-category counts.
Retry Rate
Retries / attempted writes. Healthy at 1-5%. High retry rate wastes worker time.
- 20% retry rate — rate limiting is likely
- 40% retry rate — server is overloaded
- 60% retry rate — stop the import, investigate
For the parallelization side of retry management, parallelizing an import without corrupting references is the entry.
Batch Commit Latency
Time from batch submitted to batch confirmed committed. Baseline for your target server; alert when latency doubles.
Growing latency is the leading indicator of a stressed server. Catch it before writes start failing.
Queue Depth
If workers are queueing waiting for the server to accept, throughput is bounded by the server, not the workers.
Queue depth = 0 — workers are the bottleneck (add more workers if possible) Queue depth > 5 — server is the bottleneck (throughput is capped)
That single metric tells you where to focus.
Server Error Rate
5xx per second from the server. Should be near zero. Any spike is a signal.
Categorize by code:
- 503 Service Unavailable — server overloaded
- 500 Internal Server Error — server bug
- 401/403 — auth problems
Different causes, different fixes.
The ETA Update
Every minute, recompute the expected finish time from actual throughput:
- Remaining resources / current writes-per-second = seconds remaining
- Add to current time = expected finish
That is the real ETA. Compare against the planned ETA. If they diverge more than 20%, adjust the plan.
For the traffic-window planning, planning an import around production traffic windows is the entry.
The Progress Dashboard
Every operator running an import should have visibility into:
- Percent complete (approximate)
- Current writes per second
- Success rate
- Estimated finish time
- Any active alerts
That dashboard is the primary interface. Metrics are what powers it.
The Alert Ladder
- Info — import started, expected finish time
- Warning — throughput below 50% baseline, sustained 5 minutes
- Error — success rate below 90%, retry rate above 20%
- Critical — import stalled, no progress for 10 minutes
Every alert level has a different response. Page for critical only.
The Post-Import Report
At end of import:
- Total resources imported
- Duration
- Actual vs estimated throughput
- Error categories with counts
- Recommendations for next import
That report is what improves the next estimate. Feedback loop.
The Short Version
Six metrics. Compare against estimates. Diagnose from categories. Update ETA continuously. Progress dashboard for the operator. Alert ladder that matches severity. Post-import report for the feedback loop.
Sources
- HTML - HTML, HL7 FHIR - OperationOutcome resource definition
